
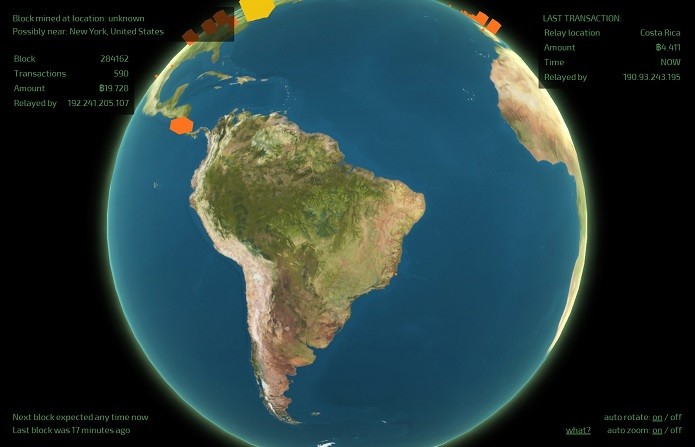
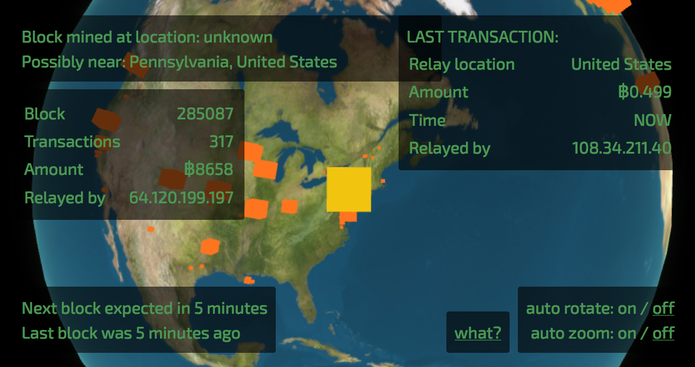
The process of mining and transferring Bitcoins is represented across the virtual globe using the participant’s IP address, which van Rossum was able to convert into basic geo coordinates using an open source project stored on GitHub. The result? A virtual representation of Earth that spins back and forth in real-time, displaying a series of orange squares that change in size depending on the number of Bitcoins that have been traded. Every ten minutes, Bitcoin transactions are then grouped together into a block, represented by a yellow square, which forms part of the block chain. Using the tables in the top left and right-hand corners of the page, it’s possible to keep track of the most recent transactions and blocks, as well as when the next block is expected to be produced.
The site has its flaws – at maximum speed, the globe will only move every 0.3 seconds to show a new transaction. If something new occurs within that timeframe, the globe will skip it to avoid sudden movements that make the site look buggy. Less than 1 percent of blocks and transactions are missed this way though, according to van Rossum. Nevertheless, it’s a mesmerizing site that we would happily watch for hours on end. Bitcoin is phenomenon and this site highlights the reach it has globally. It’s also interesting to see where the majority of blocks and transactions take place in different time zones throughout the day. Top work, van Rossum.
See the live product: http://blocks.wizb.it/
Source: The Next Web blog
Image credit: George Frey / Getty Images
Coole app, maar ik zie dat de waternoodsramp zich heeft voltrokken in Nederland :-P